FastAI Deep Learning Journey Part 7: Calculating crowd size using image regression, a potential application for train use
In the previous post we show how to use a more general approach for the case when images may have one, multiple or any label at all. In this post, we will show how very little changes are required to implement computer vision deep learning methods for regression problems.
To make things less theoretical, we picked a very interesting data set, containing 2000 images from people in a shooping mall. Each picture has been carefully labeled, where we can find between 12 to 60 people. This could be a very interesting application for example for public transport usage, as the extension of monthly tickets may very hard to track the usage of each train/bus or other service in real life.
We will show that with only 3 epochs /1GPU we managed to get ~2 MAE (mean absolute error) or in order words, get the counting wrong 2+/- person, which is really not a lot considering we can have 60 people in the image. Let see in detail what needs to be changed and explain a potential usage for public transport usage tagging to plan the frequency and estimate demand.
Data assembly, very little or now change
After doing that we can create the following datablock:
Training a model with different metrics and loss function
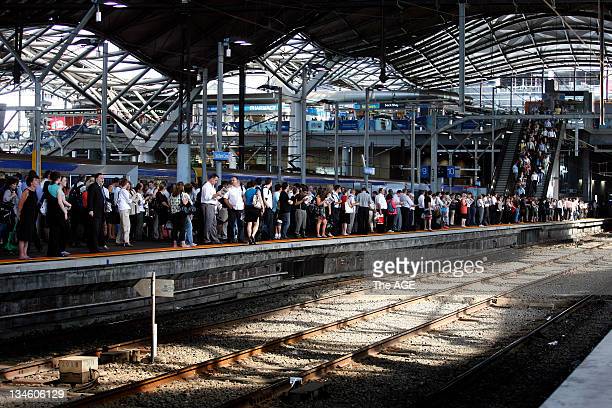
A potential application for public transport
As we speak, Germany created a monthly ticket for most public transport that does not required validation ( as long as the reviewer did not check, which could happen ~ 2/3 of the times).
This means that there is not way to know how many people are in a station, lane, train, bus at any given time. If we are planning to provide low price but high confort transportation, we need to match very well demand and supply.
If tickets like the 9euro ticket in germany or any other monthly tickets worldwide are used, together with inflation is energy but in general, higher use of the public transport is expected, and therefore more saturation at peak times.
To avoid delays, overcrowding and incorrect allocation of time frames, our model can be use to track in real time the usage, which could help to take short term and long term planning decisions. With sufficient visibility of the demand, we should be able to predict it better, or at least know the routes and times that require more capacity. This could be critical to improve the current public transport service and to ensure more population is using it as the main mode of transportation.
It is not sufficient to make it cheap, we need to make it reliable, confortable and safe, which requires very good demand and supply planning. Given the availability of cameras in lanes and many vehicles it should be possible to implement that in production.
I hope this post inspire public transport planners and policy makers to consider image regression as an ally for the affordable, punctual, safe, clean public transport we all want to have.


Comments
Post a Comment